Hi! you can call me Maleek. I'm an Azure and Microsoft Fabric Data Engineer / Analytics Engineer.
Welcome to my Portfolio website
Projects
The Data Youtubers Dashboard
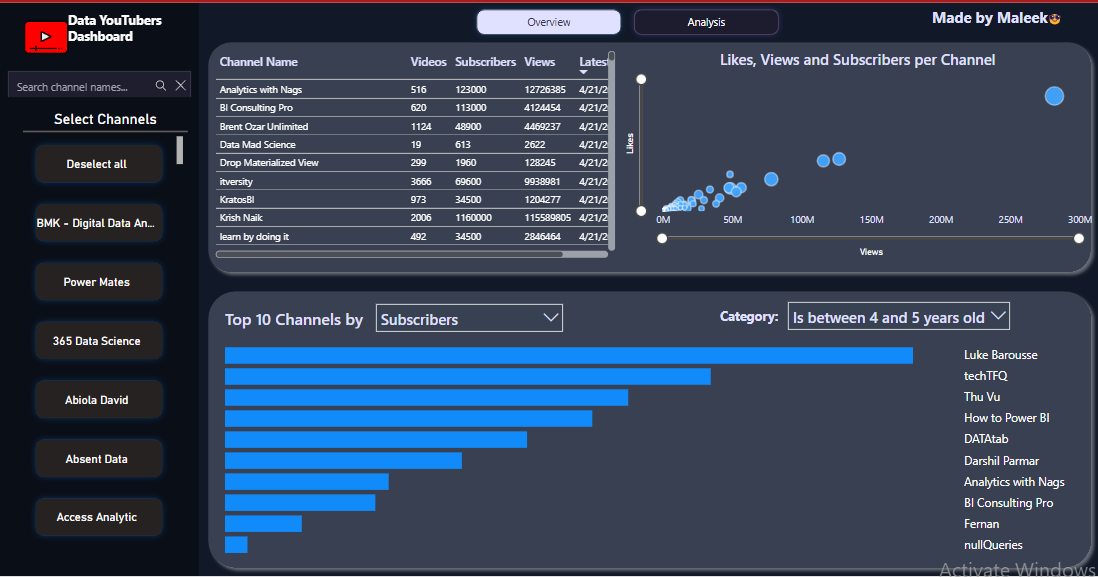
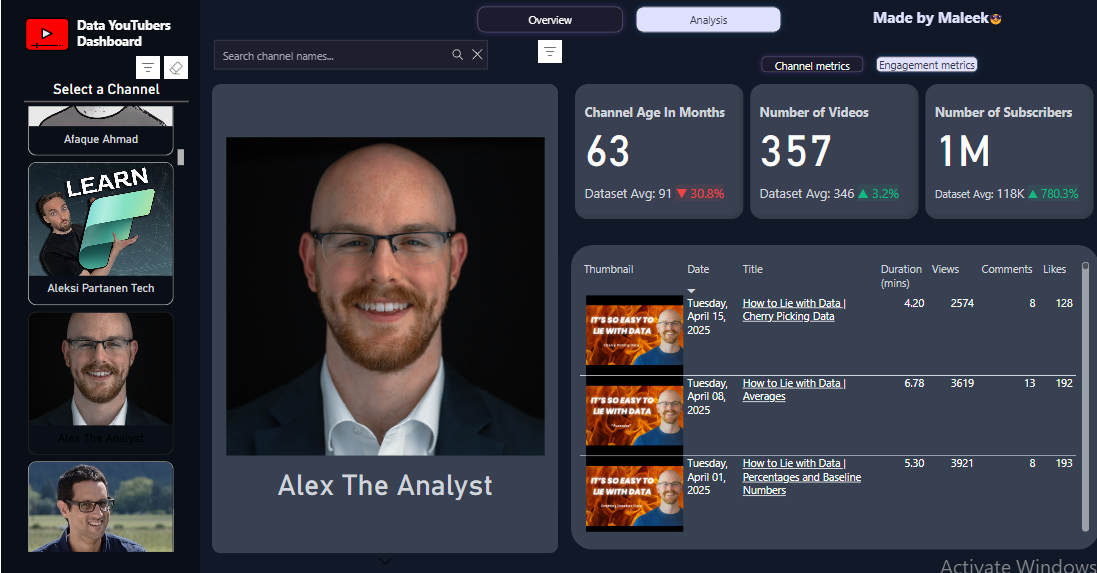
- Built a public dashboard seen by 30,000+ people in the data community.
- It has helped 150+ YouTube creators benchmark their performance against peers in the data industry.
- It has enabled thousands of learners to discover new creators and explore interesting insights about data YouTube channels.
- Designed and deployed the entire pipeline in Microsoft Fabric: from calling the YouTube Data API, to transforming and storing the data, to orchestrating daily refreshes with Fabric Pipelines, and finally visualizing metrics in Power BI.
Microsoft Fabric Setup Automation
- Fabric developers often lose time on new projects recreating existing data items across tenants or workspaces due to permission and migration constraints.
- Built an automated setup for an end-to-end Microsoft Fabric project using the Fabric REST API and Python.
- Reduced a multi-day manual setup process to under 5 minutes.
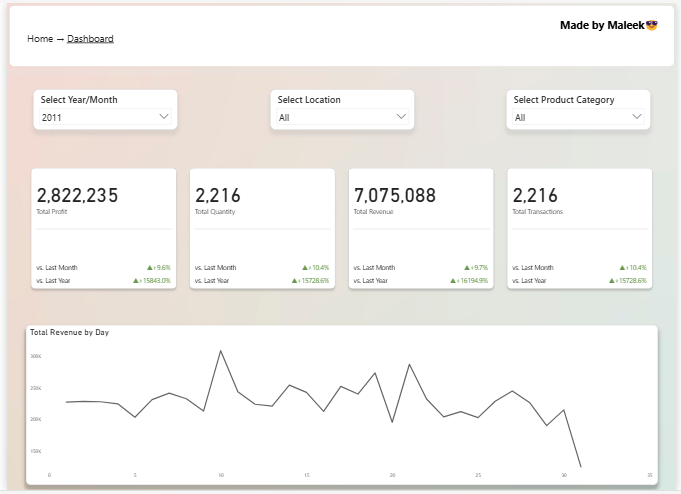
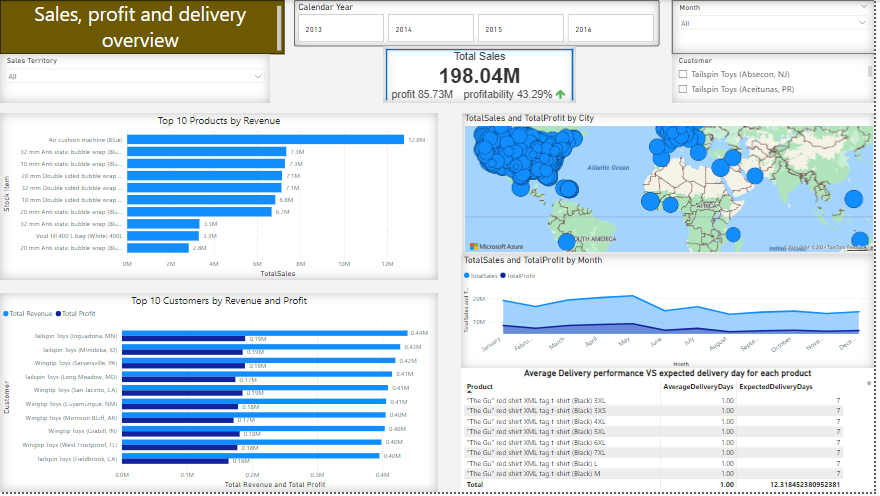
ETL and Reporting for WWI Retail Store using Microsoft Fabric
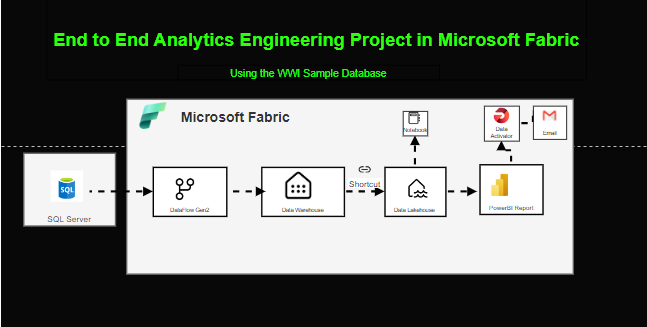
- Ensured that up-to-date insights are always available about the business data without manual intervention, by automating the ingestion of clean data from SQL Server into Microsoft Fabric and stakeholder dashboards.
- Helped the sales ,marketing and delivery teams make faster decisions by visualizing important KPIs like the best-selling products, top-performing regions and average delivery time.
- Implementing a data activator alert system that automatically notifies stakeholders when key sales or delivery metrics exceed predefined thresholds. Enabling quicker responses to potential issues and opportunities.
Product Analysis Dashboard

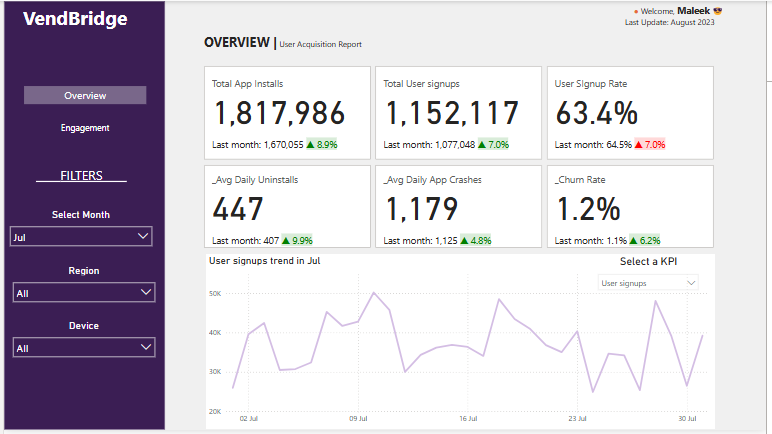
- The fictional product team at Vendbridge needed better visibility into app performance and user behavior across different regions, months, and devices to improve user experience and drive growth.
- Built an interactive dashboard that tracks total app installs, user signups, signup rate, churn rate, average daily crashes, uninstalls, daily active users, average time spent, and total transactions. All filterable by month, region, and device, and compared key metrics month-over-month.
- This empowered the team to quickly identify growth trends, spot issues like high churn or crash rates, and make data-driven improvements, leading to faster responses and more informed product decisions.
PowerBI CUSTOMER CHURN ANALYSIS FOR PHONENOW
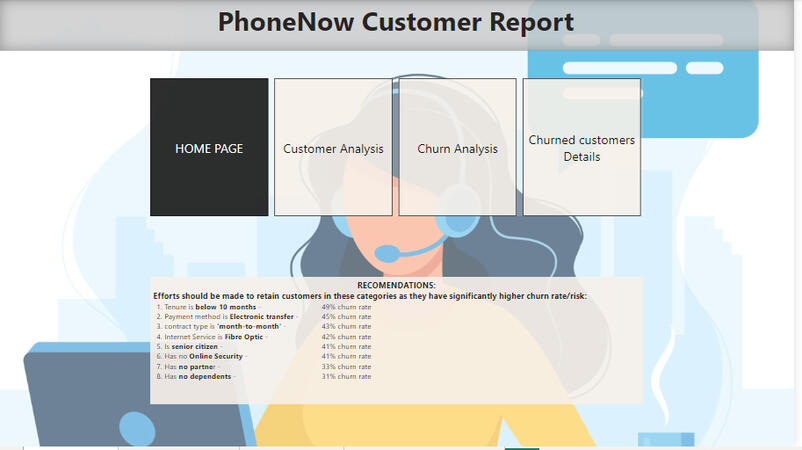
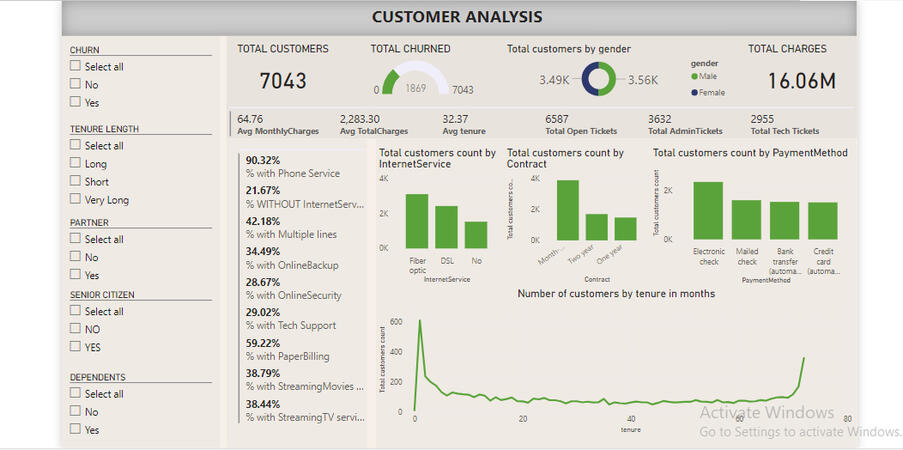
- Enabled the retention department to identify at-risk customers before they churn.
- Provided data-driven insights to improve customer retention strategies for all customers segments.
- Provided actionable insights for reducing customer churn rates.
PowerBI: D&I REPORT FOR A TELECOMS COMAPNY
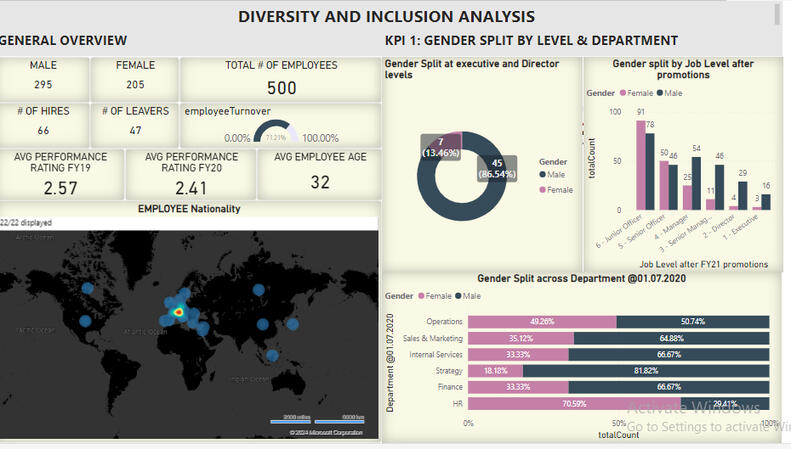
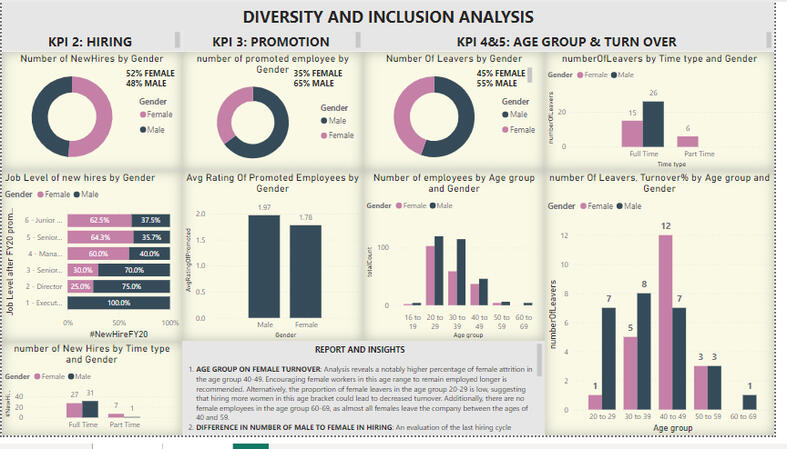
- Defined and visualized KPIs related to hiring, promotion, performance, and turnover, focusing on gender balance.
- Designed visualizations that streamlined reporting and communication, reducing the time to assess diversity metrics from 'almost forever' to instantly!.
- Provided clear and actionable insights into gender imbalances across departments and age groups, enabling leadership to prioritize diversity initiatives
Python: TMDB MOVIE DATASET INVESTIGATION
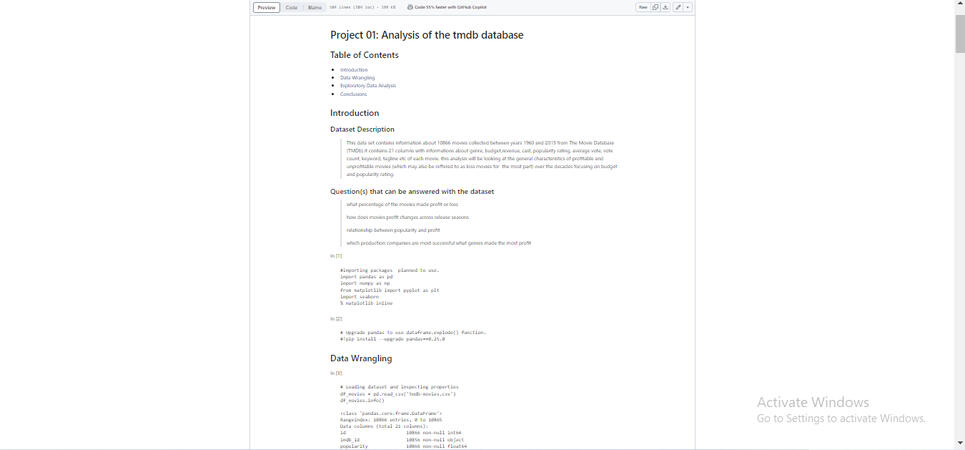
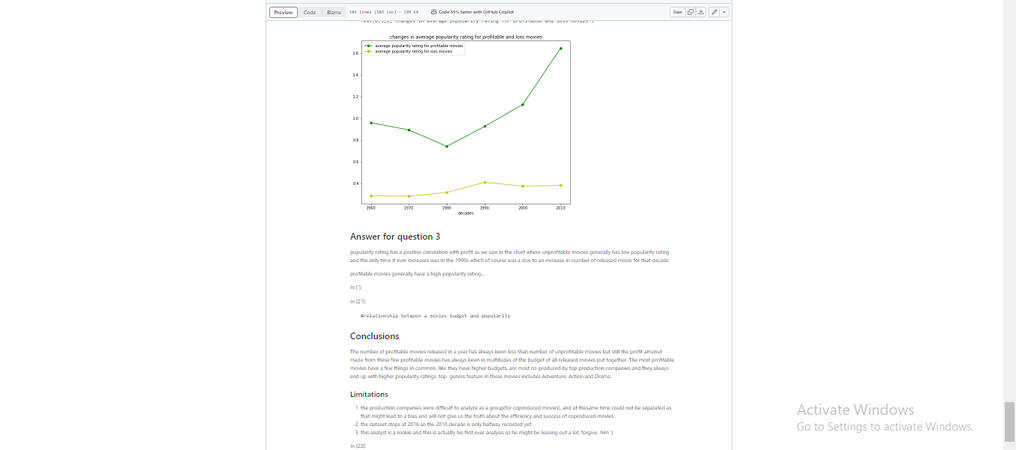
- Defined and analyzed key metrics like genre popularity, budget vs. revenue trends, and average ratings, providing clear insights about movie trends
- Created interactive visualizations that helped identify the most profitable genres and release periods, aiding in strategic content planning for filmmakers
- Created clear visual reports that shows trends in movie ratings and release dates, supporting data-driven decisions for movie release by filmmakers.
Python: TWITTER PAGE ANALYSIS
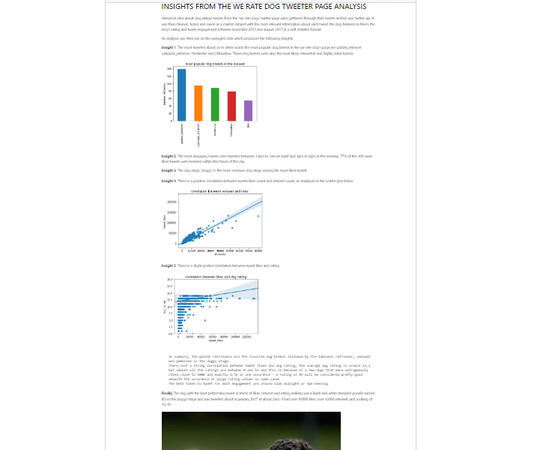
- Identified key engagement patterns, boosting tweet visibility by posting during peak times
- Helped the account refine its content strategy by discovering the most popular and highly rated dog breeds.
- Implemented data cleaning and transformation best practices in the pipeline to ensure reliability and accuracy of future analysis.
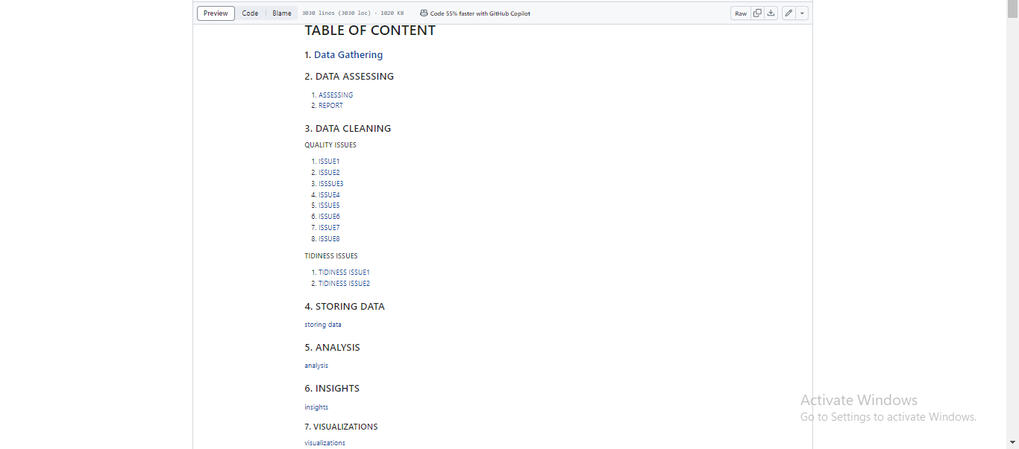
Python: LOAN DATA ANALYSIS
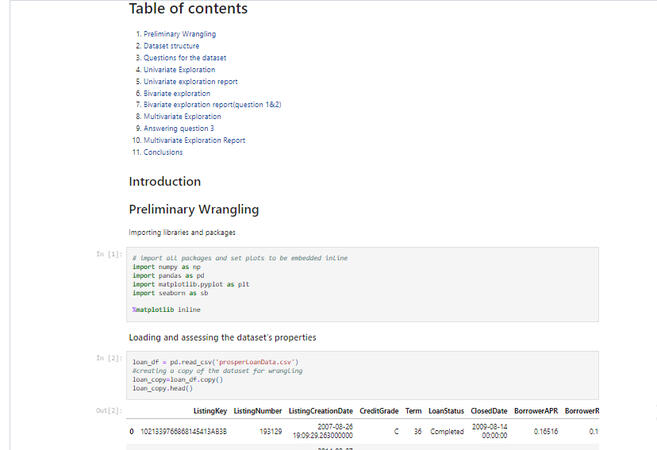
- Helped improve loan approval decisions making by identifying important factors that are related to loan defaults.
- Saved time by creating automated reports that track borrower trends, credit scores, and repayment patterns.
- Reduced losses by identifying high-risk borrowers early, allowing for quicker action to manage those risks.
BLOG
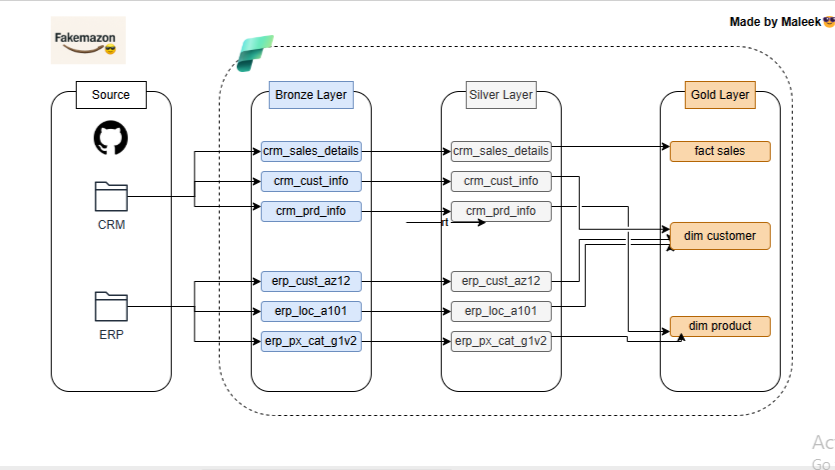
Eating Data for Breakfast: Designing and Building a data warehouse in Microsoft Fabric (for Fakemazon)
Practice project on building a dimensional data warehouse in Microsoft Fabric
Eating Data For Breakfast: Building a Simple Dimensional Model in Fabric Warehouse
A step-by-step guide to building a dimensional model in Microsoft Fabric Warehouse, including practical tips and lessons learned from real projects.
Eating data for Breakfast - Getting acquainted with Data Modelling
My notes on some data modelling fundamentals
Getting acquainted with PostgreSQL and SQL queries for beginners
A Step by step tutorial on setting up PostgreSQL and writing SQL queries for beginners
Building a free Data analyst portfolio website using GitHub pages and ChatGPT
A Step by step tutorial on building a free portfolio website
Setting Up Google Analytics 4 on GitHub Pages
Step-by-Step Guide to Setting Up Google Analytics 4 on GitHub Pages (With Screenshots)

Contact
Hey, let's discuss potential collboration opportunities!
You can reach me via any of the channels below👇.